Looking back to predict the future of public transport patronage
13 August 2019
When investing in public transport, we want to spend wisely, ensuring that money is put towards initiatives that help achieve strategic objectives. To assist with this, patronage demand forecasting can be used to test a scheme’s likely impact on the wider transport system, any likely changes in travel patterns and to provide an estimate of project benefits.
Over the last 30 years, Veitch Lister Consulting has provided patronage forecasting advice for a wide range of public transport projects. Many of the public transport interventions tested in our work have now been implemented in some form. To check whether these forecasts eventuated, we went back to the files. We analysed and extrapolated the results and have come to some interesting conclusions, which we share in this article.
Background on Zenith
Zenith is VLC’s suite of strategic transport models, representing all major metropolitan regions across Australia. They are the most widely used transport models in the country and have been used by state and local governments for the planning of public transport, major infrastructure projects and land use changes.
Case studies
We have looked back at three Victorian projects, as well as one recently completed project in Canberra. For each of these projects we used our Zenith models to forecast patronage.
Case study 1
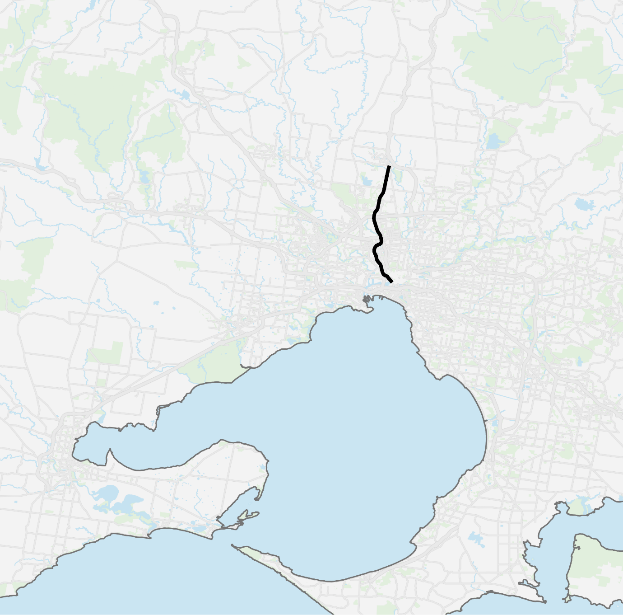
Regional rail link: western suburbs of Melbourne
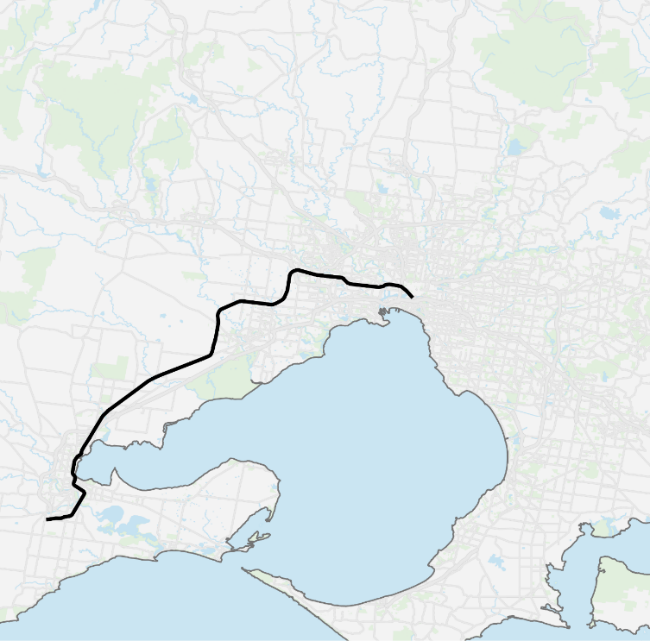
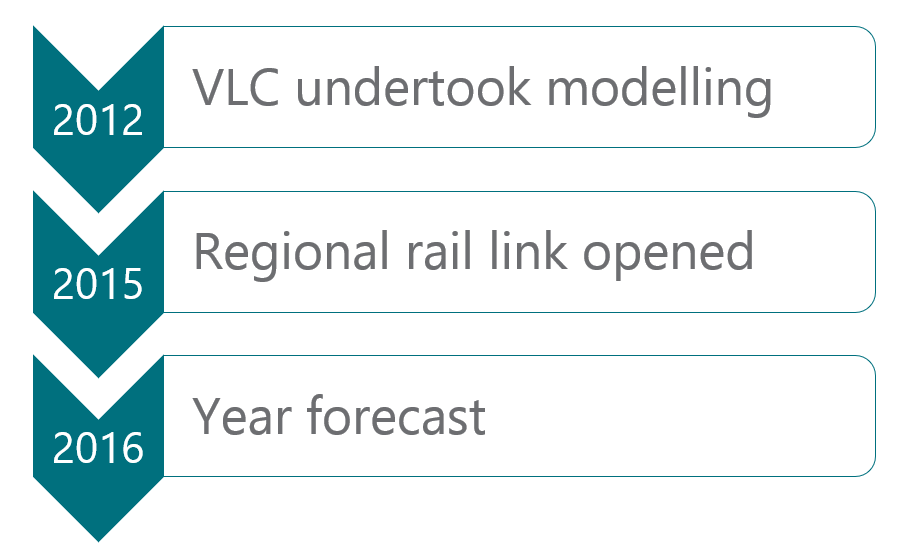
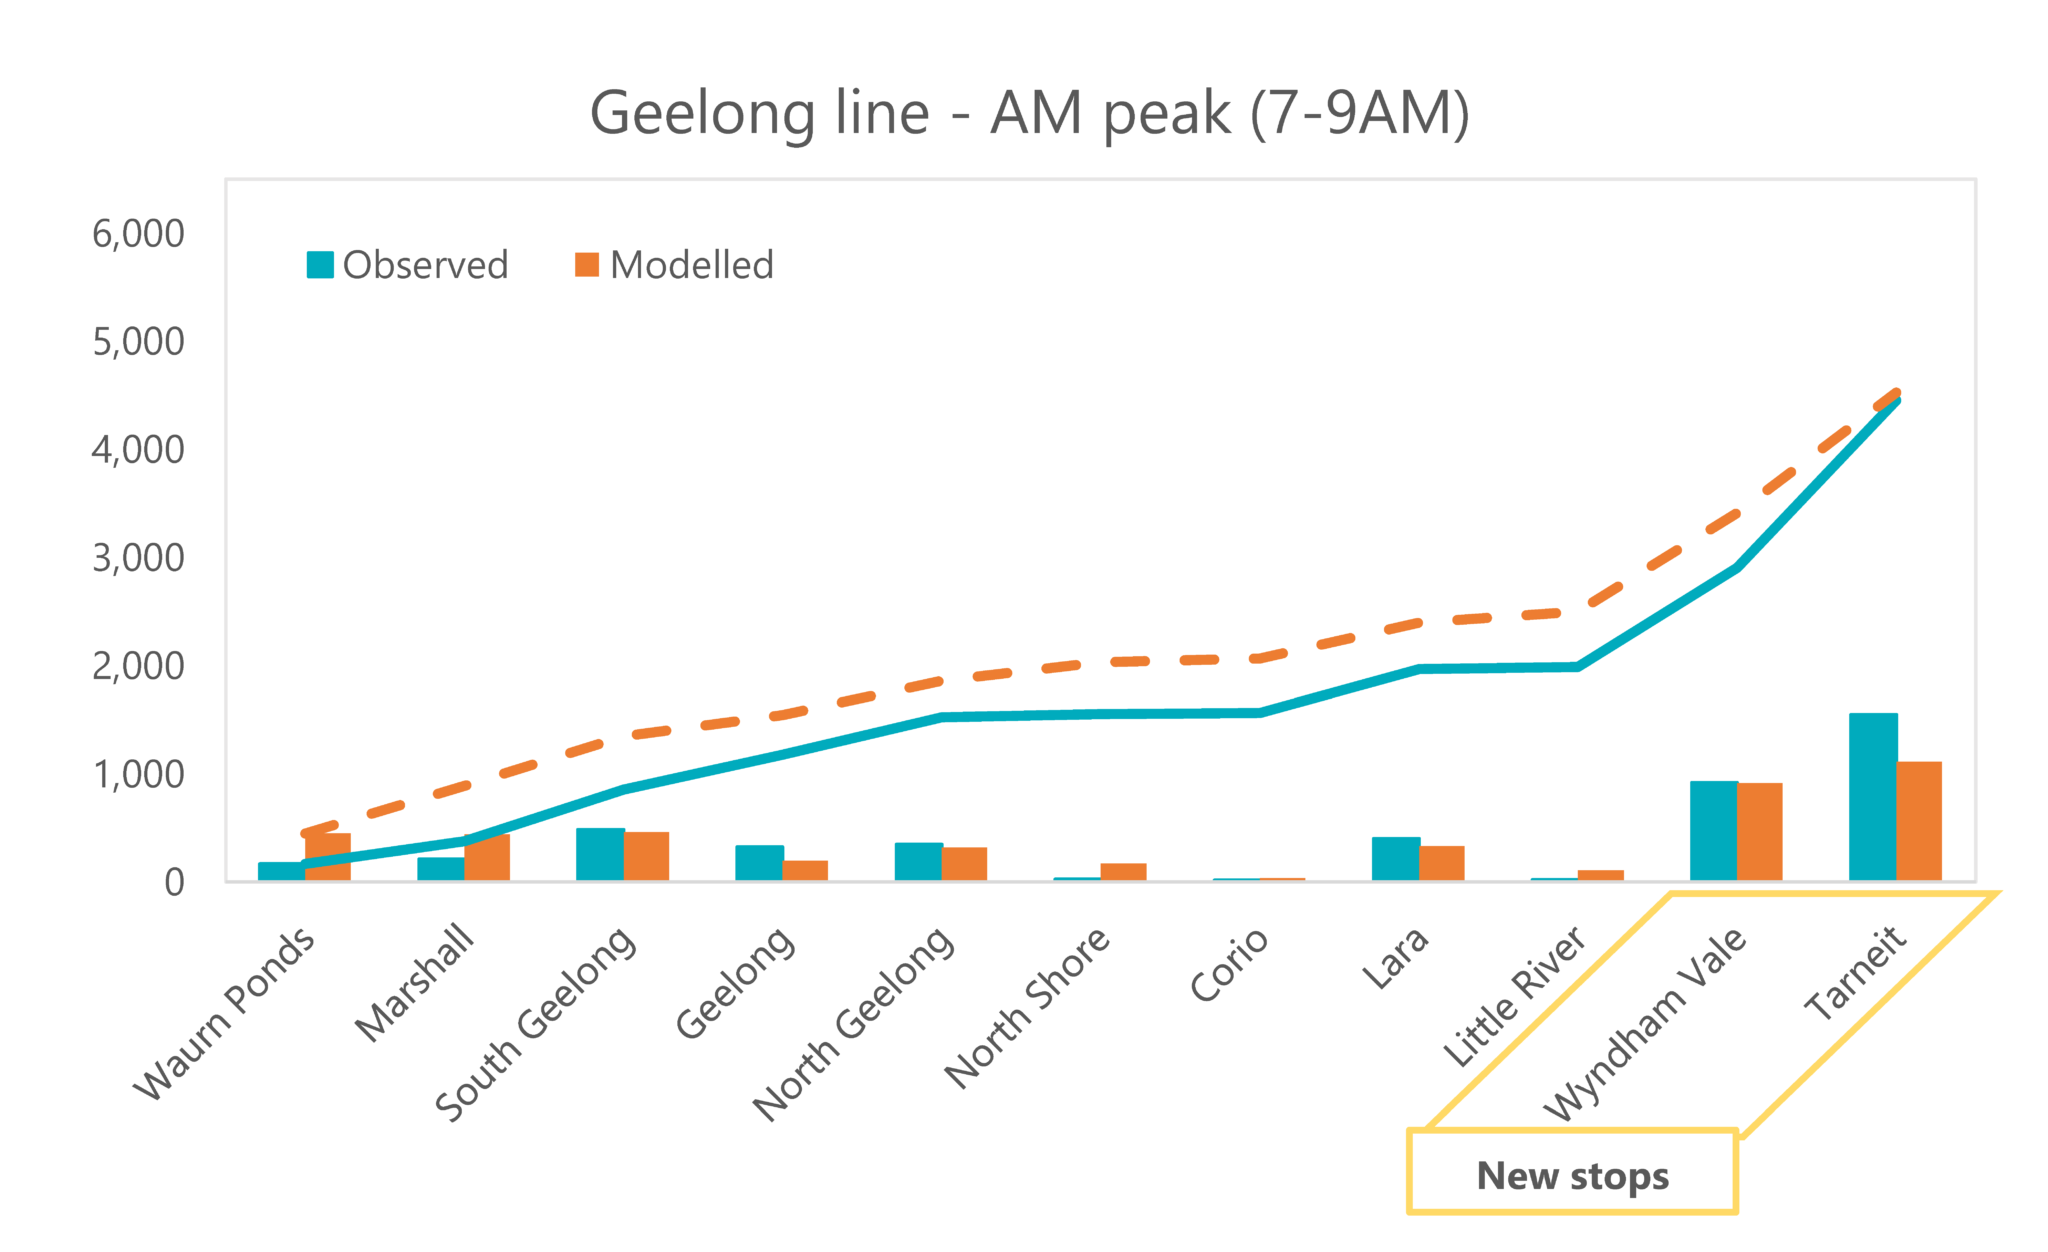
Opening in 2015, the regional rail link separated regional and suburban trains and new stations in Melbourne’s fast-growing western suburbs. The stations at Tarneit and Wyndham Vale are now served by Geelong trains, and the addition of these stations has significantly increased patronage on the Geelong line.
In 2012 VLC produced forecasts of patronage for key parts of Victoria’s rail network. Pleasingly, the model successfully predicted that the new stations at Wyndham Vale and Tarneit would attract significant patronage.
Modelled patronage versus observed patronage
Case study 2
Metropolitan rail: northern suburbs of Melbourne
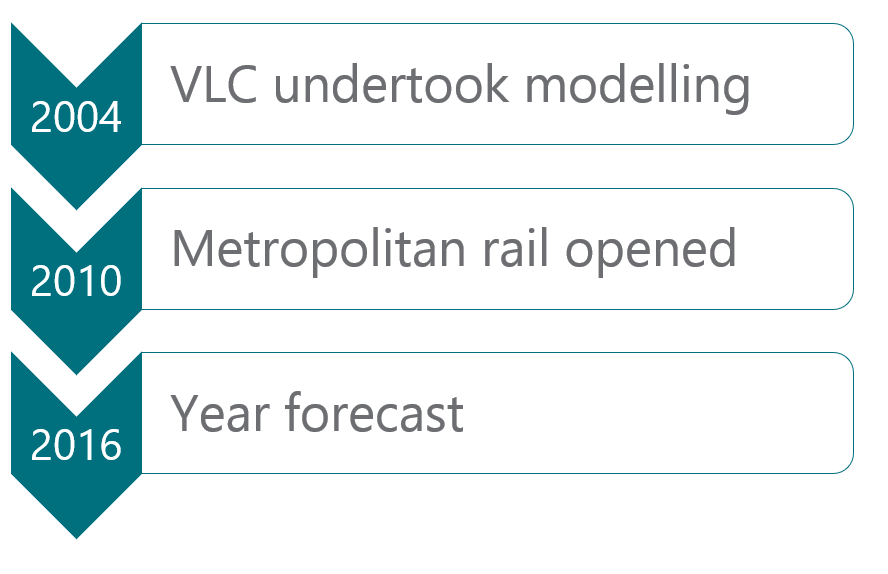
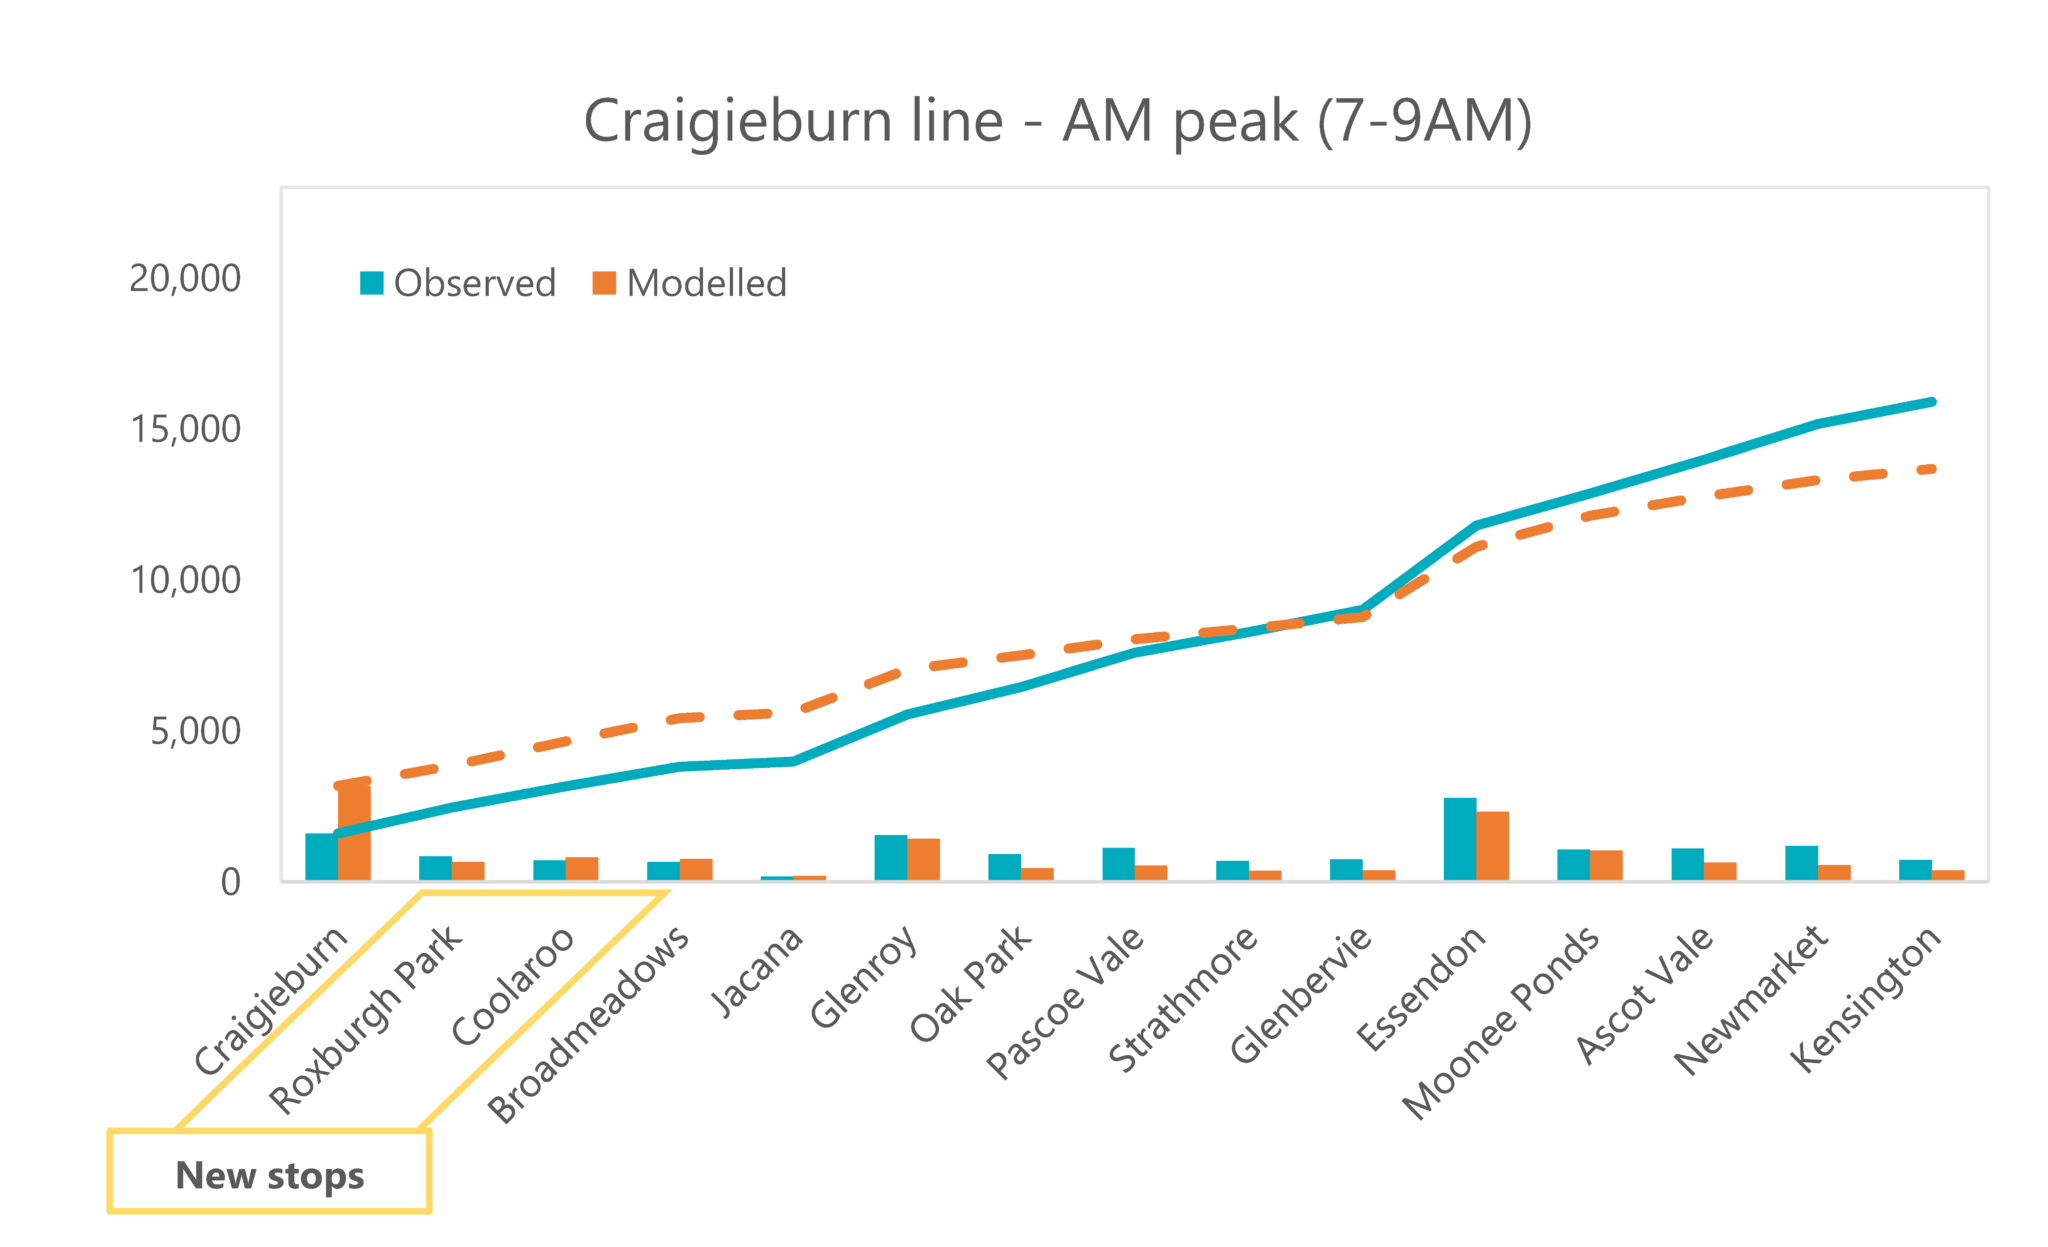
Following its electrification in 2007, new train stations were opened on the Craigieburn Line in Melbourne’s north. In 2004 VLC undertook modelling of the Craigieburn corridor, producing patronage forecasts. The modelling produced accurate forecasts for the new stations at Roxburgh Park and Coolaroo, however patronage at Craigieburn Station was overestimated.
Modelled patronage versus observed patronage
![]()
On the rest of the Craigieburn line, the modelling underestimated 2016 patronage. It is worth noting that shortly after the modelling was undertaken, patronage on Melbourne’s public transport began a period of rapid growth, with patronage increasing by almost 60% between 2003 and 2016. The patronage growth in this period is widely accepted to represent a step change in public transport usage in Melbourne, and in part reflected a change in the way Melburnians thought about public transport. Data from BITRE[1] supports this, with an increase in per capita public transport trips recorded during this period. Thus, it is possible that the model underpredicted patronage because the model was calibrated to pre-step change conditions. Despite this, it appears that the model has performed reasonably well, predicting approximately the right amount of overall patronage and identifying the busiest stations on the line.
7
Case study 3
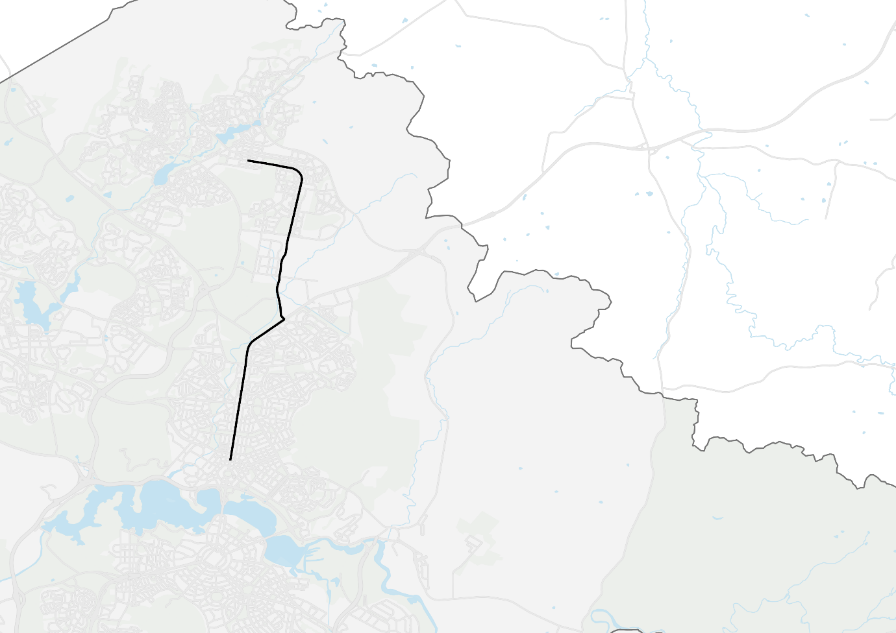
Light rail: eastern suburbs of Melbourne
4
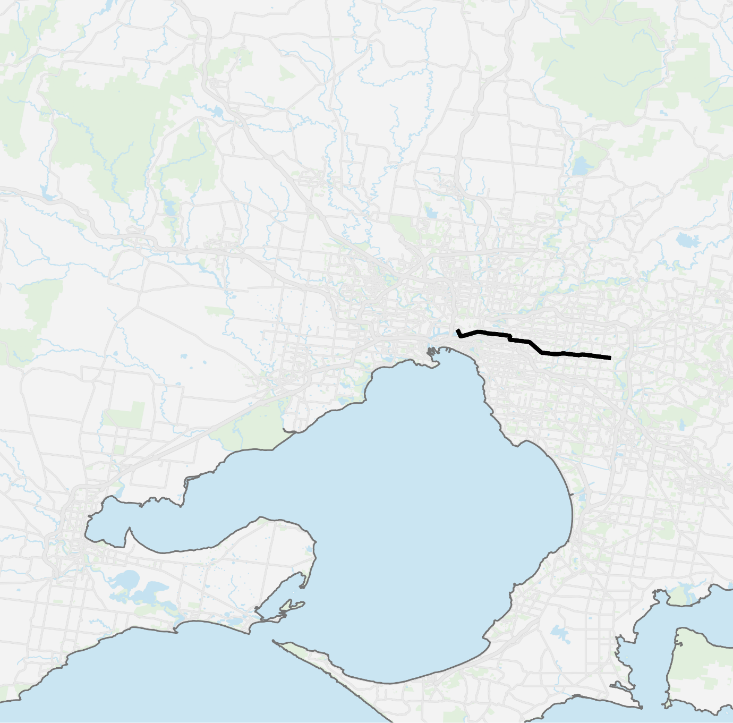
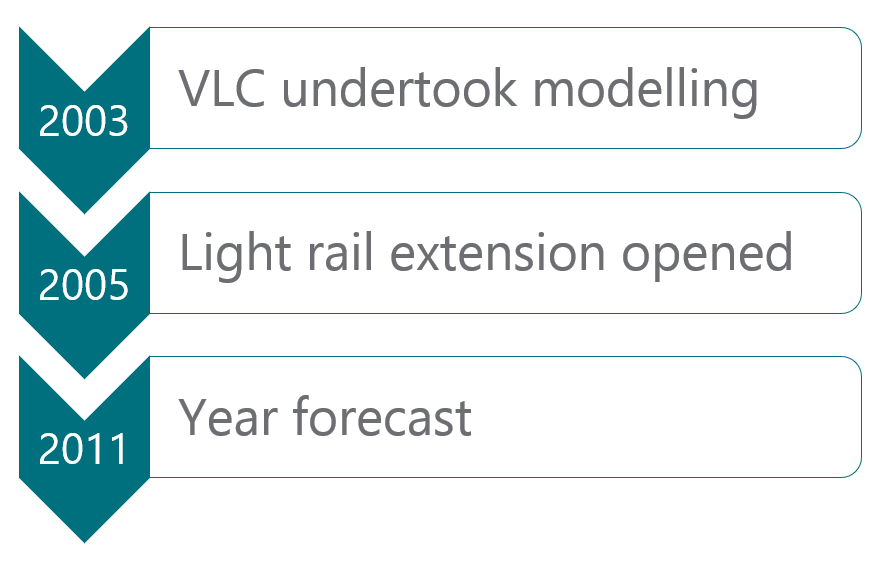
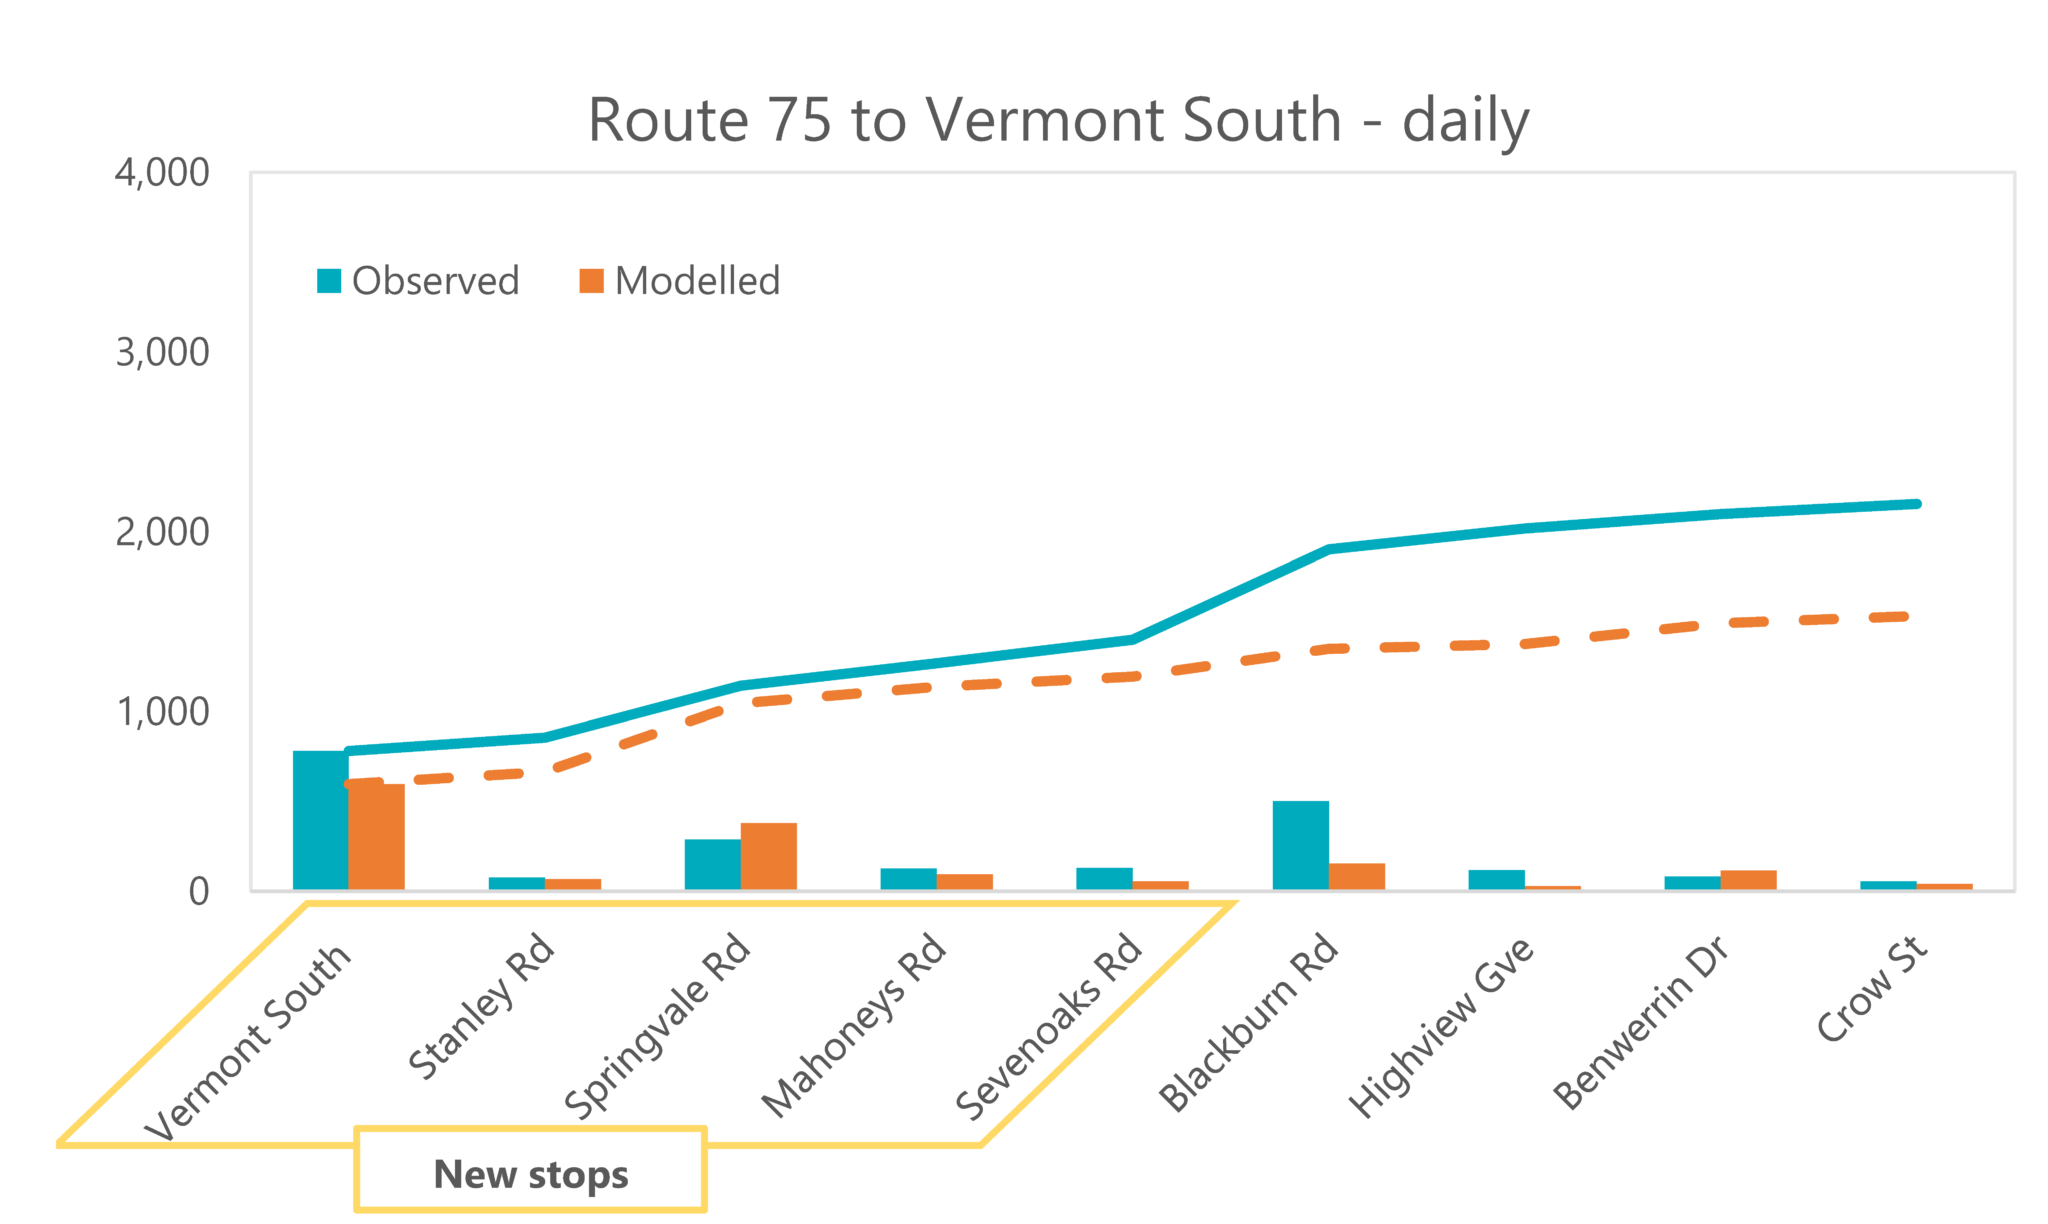
In 2005 the number 75 tram was extended to Vermont South in Melbourne’s eastern suburbs. VLC was involved in the assessment of this project and provided patronage forecasts two years prior to the line extension opening. Our modelling correctly identified that the new stops at Vermont South and Springvale Road would be heavily utilised, however the level of demand at the former terminus (Blackburn Road) was underestimated. For this study a detailed corridor validation process was undertaken, which greatly improved the accuracy of results.
Modelled patronage versus observed patronage
Case study 4
Light rail: Canberra
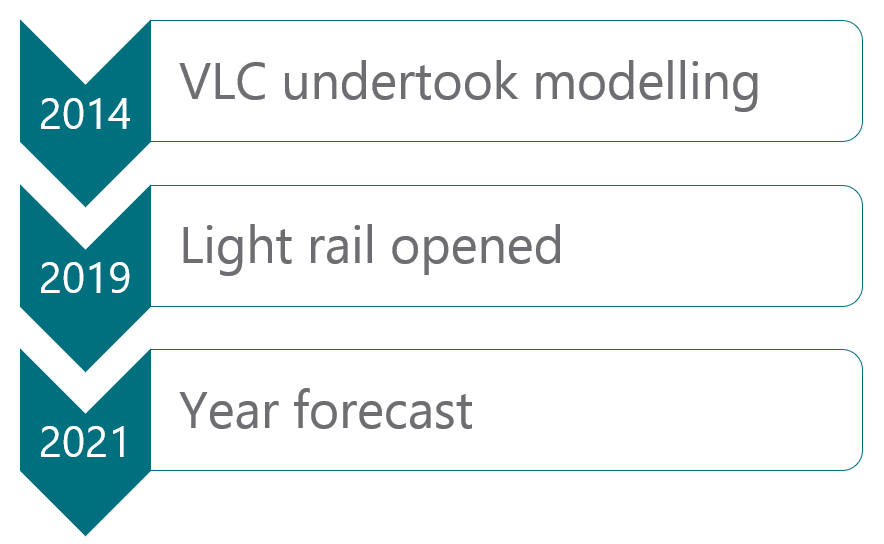
More recently, VLC supported the development of the Business Case for Stage 1 of Canberra’s light rail network, which opened in April 2019. Our modelling forecast demand of around 15,000 passengers per day in 2021 compared to actual passenger figures of 14,500 per day in 2019. We look forward to observing the future patronage numbers for this project, particularly as more disaggregate observed data becomes available.
The findings
Intuitively we expected several factors to come into play, and this exercise confirmed the following:
![]()
Validation is critical
A major factor in a strategic transport model’s performance is validation, where the base year model results are compared to observed surveys. In undertaking this exercise, it has emerged that the most robust forecasts were achieved where a comprehensive validation exercise had been undertaken on the corridor being studied.
![]()
Unanticipated population growth will impact forecasts
The number of trips made in the model is directly related to levels of population and employment. Thus, to provide accurate transport forecasts, the underlying demographic forecast assumptions must also be robust. For instance, the rapid pace of Melbourne’s population growth has meant that some of the demographic forecasts used in transport modelling have not accurately represented the city’s population. In such a case, this will lead to an underestimation of patronage.
![]()
Expect that nuances of public transport service will have an impact
Public transport networks have more attributes than road networks (including service frequencies, stopping patterns and access links). This makes modelling public transport more complicated and the performance of modelling dependent on how the route service assumptions compare to what was implemented. This factor needs to be considered when looking at results.
In summary
Undertaking this analysis uncovered some pleasing results and confirms our Zenith models’ capability to estimate the level of travel on new public transport infrastructure. Modelling patronage on public transport is complex, and not a perfect science. But in the absence of a crystal ball, it provides a robust substitute.
Contribution from Aaron Alaimo gratefully acknowledged.
[1] Bureau of Infrastructure, Transport and Regional Economics (BITRE), 2014, Long-term trends in urban public transport, Information Sheet 60, BITRE, Canberra, p.10 https://www.bitre.gov.au/publications/2014/files/is_060.pdf