Modelling Freight in Australia
15 October 2016
In past years, freight modelling capabilities in many road agencies have failed to keep pace with a growing need for tools that inform policy. Further, according to a 2008 study by Ibis World, bulk and non-bulk freight in Australia is expected to grow by close to 280% and 350% respectively between 2008 and 2050.
Here at VLC, we believe that the expected growth and the impact thereof on the transport task needs to be better understood. Freight modelling is a very important tool to properly plan our infrastructure (especially interstate roads and railroads) for decades to come. We therefore decided to apply over ten years of experience in freight modelling in the US and Brazil, and some proven modelling techniques, to the task of modelling freight in Australia.
To support this task, we have been gathering freight-related data sets, including the ABS Freight Movement Data, which provides road freight movements for the whole of Australia at an SA3 level of aggregation.
To complement the ABS data and to develop freight forecasting models, we are collecting data sets from Census, open-data portals, and satellite imagery, among many other sources. We are also employing a number of GIS and data fusion techniques to build custom data sets based on this large number of sources, and exploring how each one of these datasets can improve our understanding of freight movements throughout Australia.
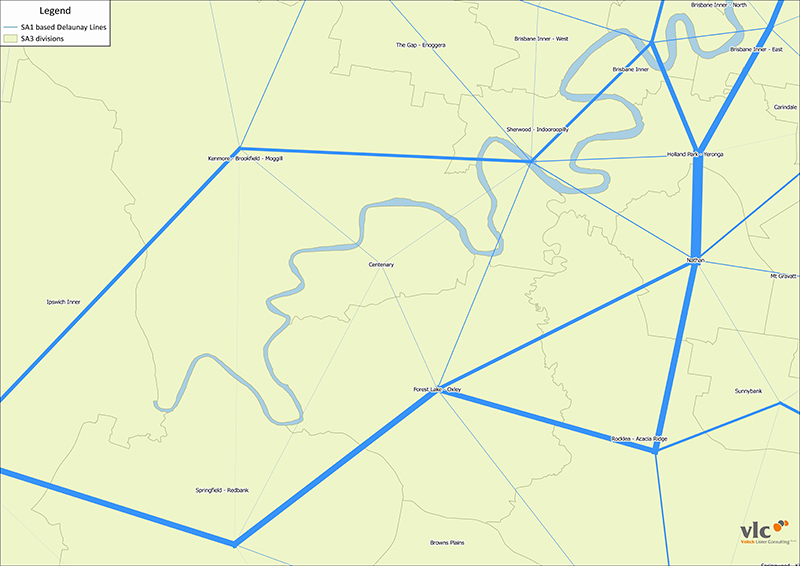
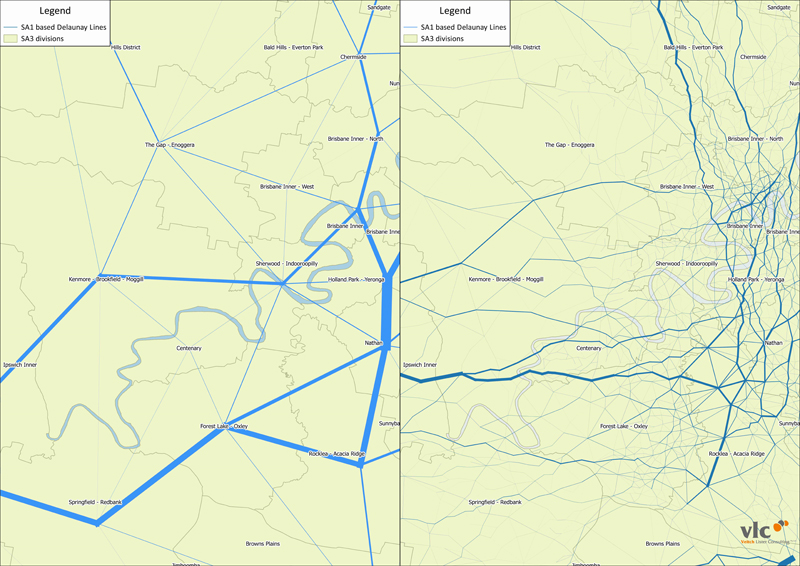
One of the visualisation techniques we used to analyse the ABS data was Delaunay lines (a type of desire line), which provide a clear representation of the general movements included in, for example, a general freight matrix. The result of this visualisation for a region such as South East Queensland clearly shows the observed freight flows. However, as the data is at SA3-level, it is clearly not disaggregated enough to understand the movements in and out of major industrial regions, seaports and airports. Further, close to 58% of the total movements of general freight for the State of Queensland are intrazonal at the SA3 level, which does not enable any kind of network analysis.

To address these issues and to enable more sophisticated use of the information available from ABS, we developed a framework for disaggregating these SA3 freight matrices to much more detailed geographic levels. This is also an important step towards building robust forecasting models.
From a pragmatic point of view, it is not sensible to work with commodity-based freight matrices at a very disaggregated geographical level, and disaggregating these matrices to a zoning system at the level of detail of SA2s might be the most reasonable course of action. However, in order to test the applicability of our model and computational performance of the tools used, we disaggregated the matrix provided by ABS down to the SA1 level, resulting in a matrix of over 11,000 zones for the state of Queensland alone.
The results, are presented in the image below as a side-by-side comparison with the analysis done with the data obtained from ABS. As it is clear in the image, this much finer level of disaggregation makes the disaggregated SA1 information more suitable to be used in more comprehensive freight modelling and planning activities on regional, state and federal levels.

The coolest part of it? We did it all with open source software.


