Right to the City – Applying Justice Tests to Public Transport Investments
30 May 2018
Imagine you are a policy-maker working in a city that faces growing travel demands and persistent socioeconomic inequality: How might you use your transport budget to tackle both problems at once?
In this recent paper published in the journal “Transport Policy”, my co-author and I considered this very question. From a policy perspective, major transport investments would ideally be efficient—in that their benefits exceed their costs— and equitable—in that they disproportionately favour the less well-off.
To answer the second question, a number of studies have proposed accessibility-related “justice tests”. Our research sought to extend this literature in two ways” First, to test whether a project is “just” we use the correlation between the change in accessibility and socioeconomic outcomes. Second, we use a case study to explore the stability of our test, namely the “City Rail Link” (CRL) in Auckland, New Zealand. Figures 1A and 1B shows how the CRL reduces travel-times, adds new stations, and increases frequencies.
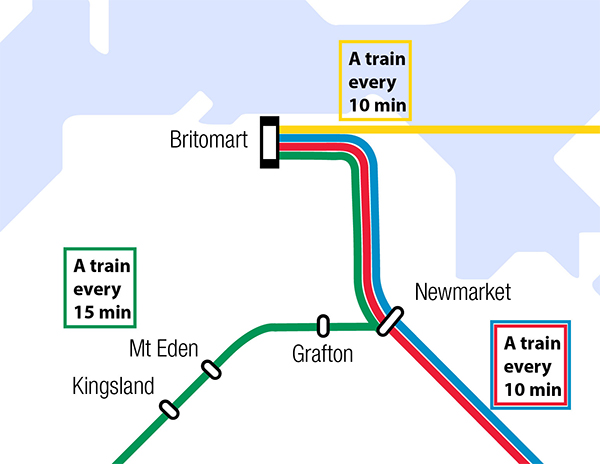 Figure 1A: Rail infrastructure and services without CRL
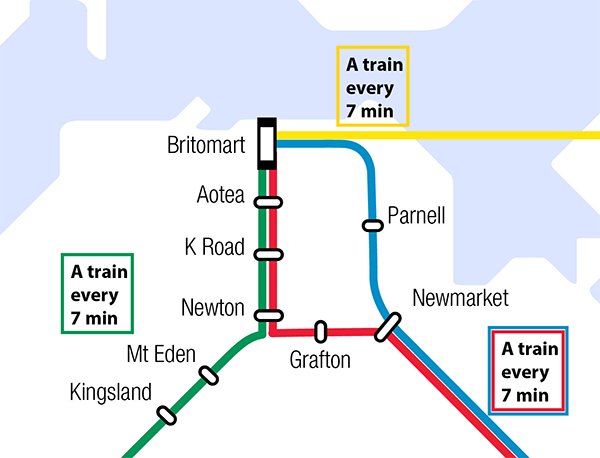 Figure 1B: Rail infrastructure and services with CRL
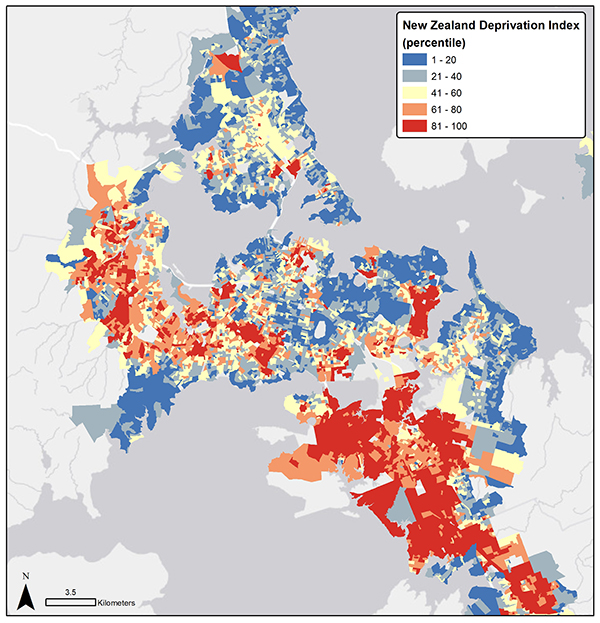
Like most major cities in Australia, Auckland is growing fast. Tests show also reveal that deprivation is highly concentrated in certain parts of Auckland, as illustrated in Figure 2 (NB: Higher percentile indicates higher deprivation).
We model the effects of the CRL using Auckland’s “General Transit Feed Specification” (GTFS feed), as shown in Figure 3. A GTFS feed consists of standardised text files containing information on the PT network, such as stop locations, route alignments, and schedules. GTFS feeds are now available for PT networks operating in more than 500 cities worldwide, providing a rich and standardised way to represent public transport networks.
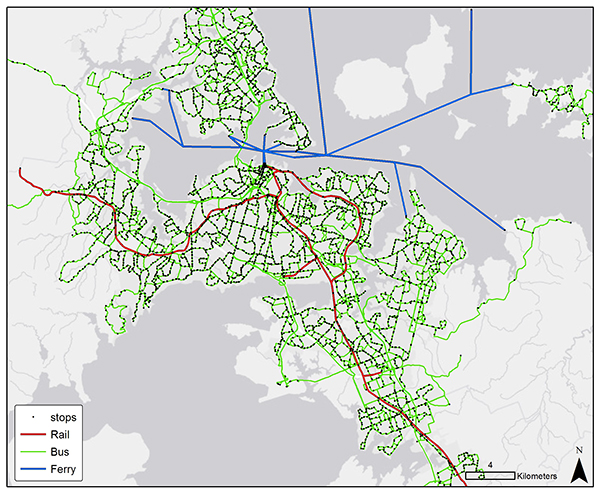
Figure 4 shows the edits to Auckland’s GTFS feed to model the effects of the CRL. We complement the GTFS feed with pedestrian networks sourced from Open Street Maps (OSM), from which we calculate walking times to access PT services. Finally, we developed a routing tool in Python to calculate PT travel-times and accessibility across Auckland.
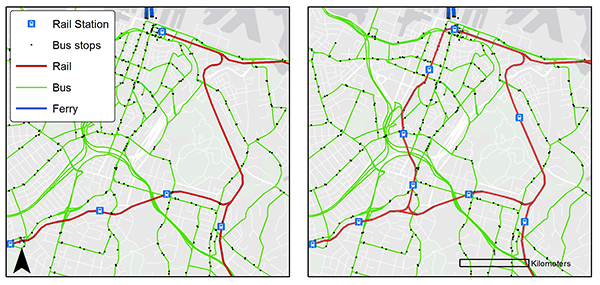
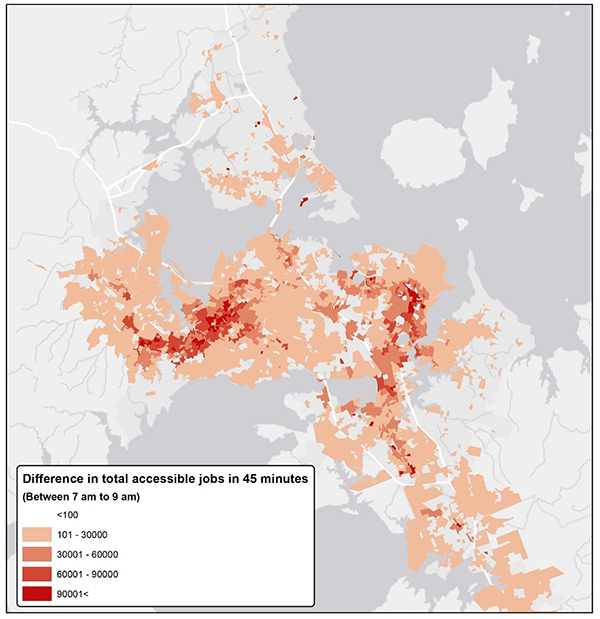
Figure 5 illustrates the change in accessibility to employment for each location when assuming a 45-minute maximum travel-time, for example. We find the CRL increases accessibility in the west, east, and south of Auckland, which broadly aligns with the areas of high deprivation illustrated in Figure 2. On this basis, one might expect a positive correlation between accessibility and socioeconomic deprivation, and so it proves: In almost every scenario that we test, we find a positive correlation coefficient between the change in accessibility caused by the CRL and prevailing socioeconomic deprivation. On this basis, we conclude that the CRL is a relatively “just” project.
We are the first to admit that our approach is certainly not perfect. Using the correlation coefficient as a criterion for justice tests may be unreliable in the presence of outliers and non-linear associations. In this specific case study, scatter plots of the underlying data points indicate neither of these two statistical issues were present. Other methodological issues, such as households that change location in response to changes in accessibility, are discussed in the paper itself. Notwithstanding these issues, we conclude that the justice test proposed and tested in our study presents a relatively stable indicator compared to others proposed in the literature. In jurisdictions that seek to address inequality, our justice test seems to present a straightforward tool for informing investment priorities.
Some may quibble whether a single justice test can help understand the complex and diverse effects of PT investments. We hedge our bets on this front: On the one hand, the literature identifies a gap between policy and practice in relation to justice tests. In this context, a single, stable, and simple justice test may be better than nothing. The test we present above could be used, for example, in business cases for major transport projects in Australia. On the other hand, we do not believe there exists one justice test to “rule them all”; careful application and interpretation is, as always, needed.
To finish, we emphasise that potential transport investments that do not pass our proposed justice test may nonetheless be worthy of funding for other reasons, and vice versa. Determining that a project is just, using this or any measure, does not imply that it is worthwhile. The latter question is a much broader, but equally fruitful area of study.
Acknowledgements: I appreciate input from my inspirational and talented co-author, Saeid Adli, as well as the ongoing support of friends, family, and colleagues—past and present.

