
Zenith Airport Link Forecasts – Update
12 November 2012
Veitch Lister Consulting (VLC) released forecasts on the 20th of July 2012, a week before Airport Link officially opened to the public. The numbers were released independently of BrisConnections – they were completed for an in-house research project. The released forecasts were for an average weekday (during school-term time) and without any adjustment for ramp-up effects.
Subsequent to actual traffic volumes being released by BrisConnections, a comparison can now be made between actual traffic volumes and VLC’s released numbers. VLC’s forecasts can also be compared with those provided in the Product Disclosure Statement (PDS – dated 20 June, 2008) for BrisConnections.
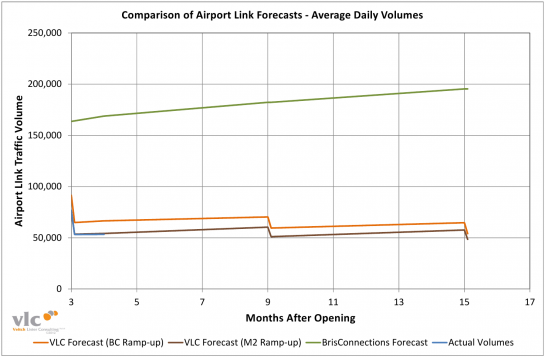
VLC’s forecast of Airport Link traffic compared to both BrisConnections own forecasts as well as actual volumes are shown below. In order to make a direct comparison, we have applied the same ramp-up profile seen within the PDS as well as applied an adjustment to go from average weekday and average day volumes (this was taken from actual traffic numbers, for both average weekday and average day for Airport Link during November 2012).
As can be seen, if we use BrisConnection’s ramp-up profile, VLC’s forecast is approximately 25% high four months after the project opens. However, if an actual ramp-up profile seen on the M2 Freeway in Sydney is used, VLC’s forecast is only 1.7% high four months after opening.
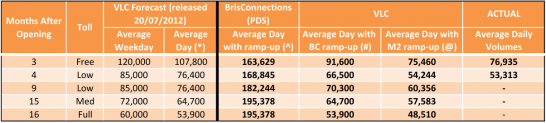
*Factor used is 0.898 (taken from November volumes for Airport Link – average weekday – 59,352 – average day – 53,313).
#Ramp-up profile was taken from BrisConnections’ Product Disclosure Statement to keep consistency with the bid forecasts.
@Ramp-up profile was taken from actual ramp-up seen on the M2 freeway in Sydney. We believe this to be a more realistic ramp-up profile than the one used for the PDS (which we consider to be too steep – see page 115 of the PDS).
^Numbers were taken from the BrisConnections’ Product Disclosure Statement It must also be noted that BrisConnections’ forecasts assumed a full toll for all periods.
We will endeavour to keep this comparison table up to date as actual traffic data is released for Airport Link.
These VLC forecasts are assuming the tolling scheme will remain in-line with the Airport Link toll information described below (sourced 06/12/2012).
- Low Toll: From 18 October 2012 until 17 April 2013, the toll for a car to travel the full length of AirportlinkM7 is $2.50. For a car travelling the shorter sections of AirportlinkM7, between Bowen Hills and Kedron or Kedron and Toombul, the toll is $2.00. See Toll pricing and charges.
- Med Toll: From 18 April until 16 October 2013, the toll for a car to travel the full length AirportlinkM7 will be $3.75. For a car travelling the shorter sections, the toll will be $2.90.
- Full Toll: From 17 October 2013, full tolling as specified under the concession deed with the Queensland State Government, will apply and tolls will be $4.90 and $3.65 in 2012 dollars
The BrisConnections Product Disclosure Statement, which includes BrisConnections’ official forecasts (not made by VLC), can be found here.